
Daily financial breakdown
Analyze revenue, clients, working time, expenses, and profit for each day
What the daily breakdown is
The daily breakdown shows the financial result of each day in the selected month. It helps you see the total and identify the busiest and most profitable days.
Select a month
Review the required reporting period
Select a month to view every calendar day and compare its figures. The data is recalculated for the selected period.
What each day card contains
The main figures for one day
Date
The date represented by the figures
Day of week
Helps compare the same weekday across weeks
Revenue
Income from completed appointments
Clients
The number of clients and completed visits
Working time
Time spent on appointments that day
Expenses
Expenses assigned to the selected day
Profit
The difference between revenue and expenses
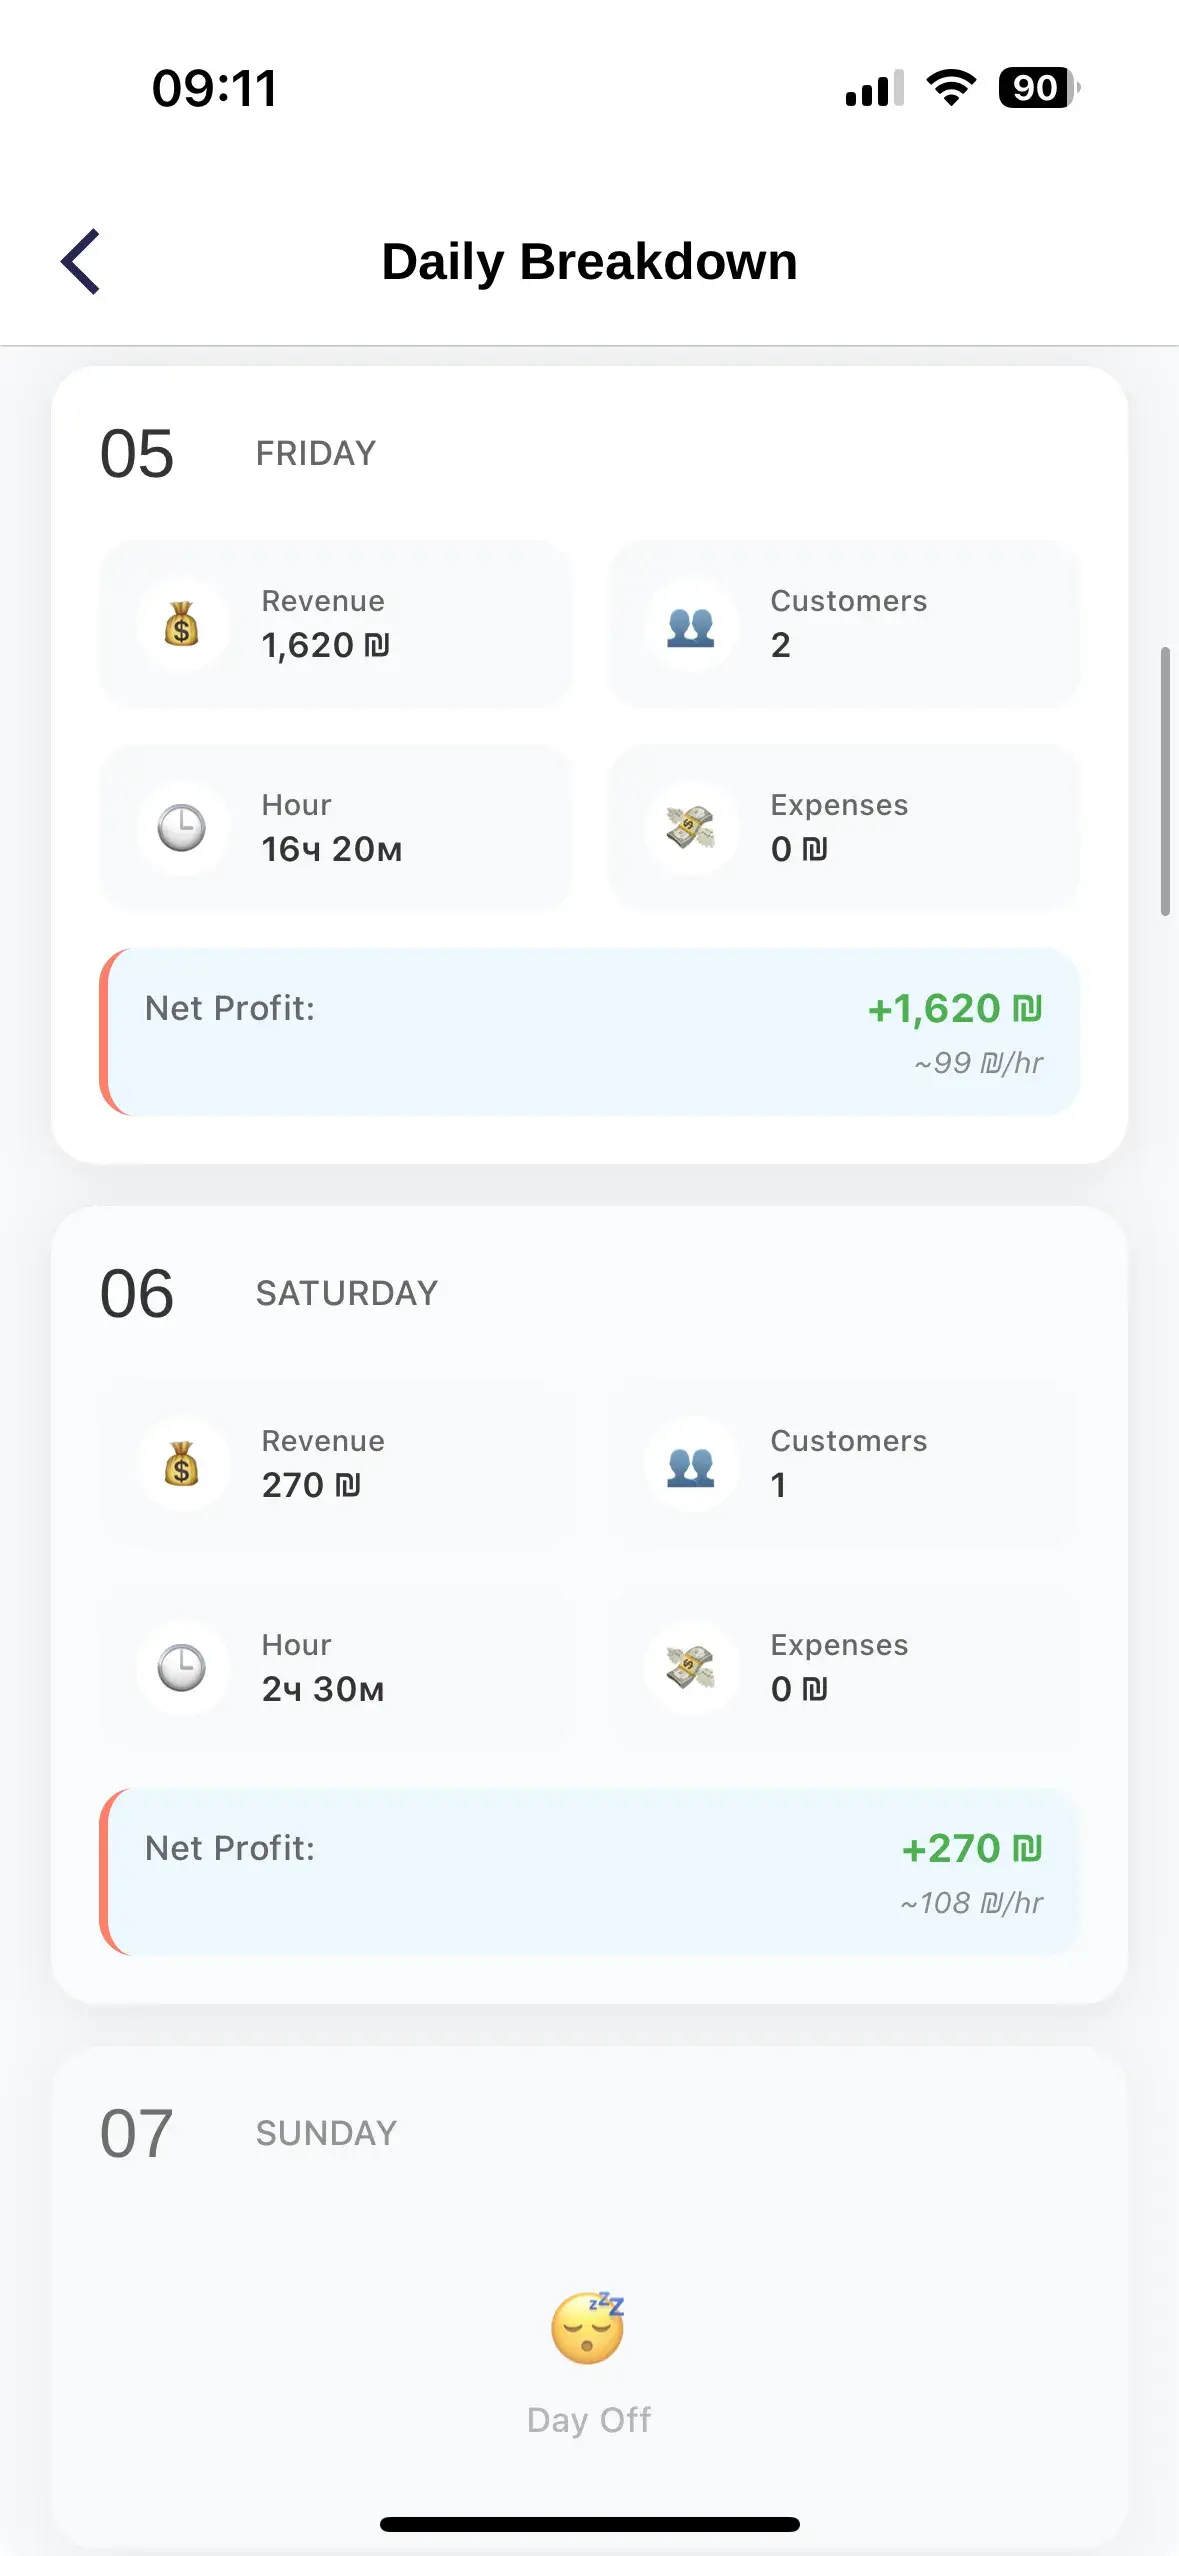
Non-working day
When a day has no work figures
If there were no completed appointments or financial operations, the card is shown as a non-working day without revenue or working time.
Working day
How the result is calculated
For a working day, the system combines completed visits and saved expenses and calculates the daily result.
Revenue
Income from completed appointments
Clients
The number of clients served
Time
Total time of completed services
Expenses
Expenses saved for that day
Profit
Revenue minus expenses
Positive and negative profit
✅ Positive result
Revenue is higher than expenses, so the day produced a positive profit.
❌ Negative result
Expenses are higher than revenue. Review major expenses, cancellations, and daily occupancy.
How to analyze a month
- Open Finance
- Open Revenue & Summary
- Select a month
- Review each day's figures
- Compare revenue, expenses, and profit
- Identify the strongest and weakest days
- Use the results to plan schedules and expenses
Insights you can obtain
Most profitable days
Show when the business produces its strongest result
Weak days
Reveal low occupancy or negative profit
Average occupancy
Shows the relationship between client count and revenue
Time efficiency
Helps compare working hours with income
What to compare
Weekdays
Compare Mondays with Mondays and weekends with weekends
Revenue and profit
High revenue does not always mean high profit
Clients and average result
The same client count can produce different revenue
Expenses
Watch for days with unusually high costs
Review trends, not one isolated day
One weak day does not always indicate a problem. Compare several weeks and the same weekdays to identify a consistent pattern.